Blog

KEY HIV STATISTICS IN NIGERIA
- Globally it is estimated that 36.7 million people are living with HIV/AIDS and 25.5 million of these PLHIV are in sub Saharan Africa. (UNAIDS, 2016)
- In sub Saharan Africa alone adolescent girls and young women accounted for 25% of new HIV infections among adults, and women accounted for 56% of new HIV infections among adults in 2015. (UNAIDS, 2016)
- Key populations account for more than 20% of new infections in sub Saharan Africa with HIV prevalence among these populations often extremely higher than in the general population. (UNAIDS, 2016)
- Current HIV prevalence among women attending ANC in Nigeria is 3.0% (ANC, 2014) In Nigeria, 58% of the estimated 3,037,364 PLHIV in 2015 were females. (Nigeria spectrum estimates 2016).
- Estimated number of new HIV infections in Nigeria dropped from 130,295 in 2010 to 104,388 with 55% (104,388) of the new infections found among females.
- HIV prevalence among key populations in Nigeria: BBFSW (19.4%), NBBFSW (8.6%); PWID (3.4%) and MSM (22.9%).- IBBSS 2014
MINIMUM PREVENTION PACKAGE INTERVENTION
- The 2009 national HIV policy has highlighted prevention as a critical strategy for halting new HIV infections in Nigeria.
- The National Strategic Plan 2010-2015 also prioritized HIV prevention as the overarching goal of the national HIV response.
- Nigeria developed her first National HIV/AIDS Prevention Plan (NPP) in 2007 for the period 2007-2009 using the Abstinence, Be faithful and Condom use (ABC) approach.
- The NPP 2010-2012 which introduced the combination prevention approach, locally called the “Minimum Prevention Package Intervention” (MPPI) was launched.
- The NPP 2010-2012 was reviewed in 2013 and lessons learned was used to develop the NPP 2014-2015.
- The NPP 2014-2015 seeks to scale up evidence-based programming using targeted interventions and standardized intervention packages at scale.
MPPI AND FLHE FACTS AND RESULTS IN 2015
- HIV prevalence has declined among MARPS: BBFSW (37% in 2007, 27.4% in 2010 to 19.4% in 2014) NBBFSW (30.2% in 2007, 27.4% in 2010 to 8.6% in 2014) except for MSM which has increased from 13.5% in 2007, 17.2% in 2010 to 22.9% in 2014 (IBBSS, 2007, 2010, 2014).
- Spending on HIV Prevention in the national response accounted for only 8.7% of total HIV expenditure in 2009, increased to 12.67% in 2011 with a slight decrease of 11.93% in 2012 before increasing to 20.34% and 25.62% in 2013 and 2014 respectively. (NASA 2015).
- In the World Bank HPDP2 HIV/AIDS Fund (HAF) project 546 CSOs in 32 states reached 83,932 FSWs, 7306 MSMs and 3345 IDUs with MPPI as at the end of 2015.
- The number of schools implementing FLHE curriculum in the country has increased six fold from 8,335 schools in 2014 to 48,551 schools in 2015.
- The number of teachers trained to teach FLHE increased from 15,995 in 2013 to 25,113 teachers as at end of 2015.
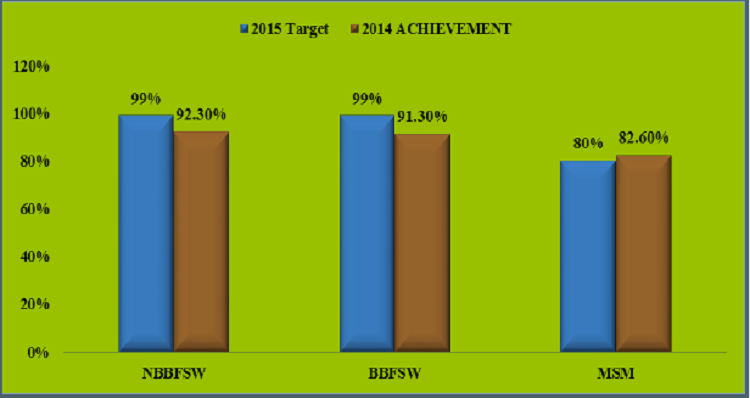
% of MARPS reporting the use of condom with their most recent client